
|
Menifee, CA
Mon Jul 09 2018 This week the median list price for Menifee, CA is $414,990 with the market action index hovering around 46. This is less than last month's market action index of 48. Inventory has held steady at or around 213.Click here to stay informed with the Menifee market! Market Action IndexThe Market Action Index answers the question "How's the Market?" by measuring the current rate of sale versus the amount of the inventory. Index above 30 implies Seller's Market conditions. Below 30, conditions favor the buyer. Today Last Month 100046 Strong Seller's Market The market has been cooling over time and prices plateaued for a while. Despite the consistent decrease in MAI, we’re in the Seller’s zone. Watch for changes in MAI. If the MAI resumes it’s climb, prices will likely follow suit. If the MAI drops consistently or falls into the Buyer’s zone, watch for downward pressure on prices. Real-Time Market ProfileNever miss important changes in the Menifee market. Median List Price$414,990 Per Square Foot$176 Days on Market44 Price Decreased46% Price Increased6% Relisted5% Inventory213 Median House Rent$2,025 Most Expensive$3,200,000 Least Expensive$218,000 Market Action Index Strong Seller's Market46 Market SegmentsClick and drag in the plot area to zoom in. Avg 7-DayAvg 90-DayJul 2015Oct 2015Dec 2015Mar 2016May 2016Aug 2016Oct 2016Jan 2017Mar 2017Jun 2017Aug 2017Nov 2017Jan 2018Apr 2018Jul2018$320K$340K$360K$380K$400K$420K$440KFriday, Dec 23, 2016● Avg 7-Day: $389,700The market appears to be hovering around this plateau. Look for a persistent change in the Market Action Index before we see prices deviate from these levels. Market SegmentsEach segment below represents approximately 25% of the market ordered by price. Median PriceSq. Ft.Lot SizeBedsBathAgeNewAbsorbedDOM $499,0003,1028,000 - 10,000 sqft43123455 $429,9002,5376,500 - 8,000 sqft4277550 $399,5002,3376,500 - 8,000 sqft42129434 $365,0001,7514,500 - 6,500 sqft321
0 Comments
The sale of a Martha’s Vineyard mansion may have ruined the Obama family’s summer vacation6/29/2018  REPOSTED DIRECTLY FROM INMAN NEWS//.WFG NATIONAL TITLE THIS CONTENT HAS NOT BEEN MODERATED BY HERITAGE HOME REALTY.
The Obama's may have to look elsewhere if they want to go on vacation this summer — the Martha’s Vineyard home where the former first family spent many a summer holiday has been sold. ‘The Chilmark House,’ which also became known as the Obama’s ‘Summer White House,’ was sold in early June for $18 million, realtor.com reports. The property, which Barack Obama and his family rented during his presidency and after, boasts 7,000 square feet, six bedrooms, an infinity pool overlooking the Atlantic Ocean and a dock. The Obamas rented the sprawling Rick Sundberg-designed mansion seven out of the eight summers of his presidency. The property, previously owned by David Schulte, features access to a private beach and is shrouded by trees. The mansion itself, estimated at $2.5 million in 2015, soared in value once it became associated with the Obama family. Upon putting the property up for sale, the owners included a photo of the former president and Michelle Obama in marketing and promotional materials while playing up the fact that the “presidential palace” was for sale. Schulte, a partner at the Chilmark Firm, a corporate restructuring firm based out of Chicago, supported Obama for president early on, even if the Yale Law School graduate didn’t immediately approve of the candidate’s Harvard roots. “I said I’m really glad to meet you, but I’m not going to support you,” Schulte told Chicago Magazine in 2013, recalling the first of his many conversations with the former president. “For one thing, you went to the wrong school … And [Obama] listened. Then he started talking and in 20 minutes he had me eating out of the palm of his hand. … The next day I was writing a $2,000 check … And after that he asked me to be on his finance committee.” The identity of the buyer was not disclosed.  REPOSTED DIRECTLY FROM INMAN NEWS//.WFG NATIONAL TITLE THIS CONTENT HAS NOT BEEN MODERATED BY Heritage Home Realty.
.Pocket listings seem to be on a lot of minds these days. Government regulators were reportedly looking into this practice of “secret listings,” and Redfin CEO, Glenn Kelman, recently criticized pocket listings at a government workshop on competition in the real estate industry. There was even recently a very popular thread on the Inman Coast to Coast Facebook page about them. The discussion has left some wondering: are they more prevalent than ever? How do they benefit buyers and sellers? Why do agents even keep some listings off the multiple listing service (MLS)? “There’s a ton of pocket listings out there,” Gary Gold, a Los Angeles-based luxury Realtor told Inman. “Buyers are asking for them, sellers are asking to have that kind of listing, and agents are using it as a tool, and it’s becoming increasingly prevalent.” Gold is speaking from his own anecdotal experience specifically to the Los Angeles market. He believes there are a number of reasons that pocket listings are increasing in volume, the first of which is simply that it’s a huge sellers market with low inventory, right now. “There’s a real demand for product,” Gold said. “If it wasn’t a seller’s market, you would have people exposing their property any way they could, because there just isn’t a ton of eyeballs. Now there’s a ton of eyeballs and people are looking under rocks for listings.” Consumers also have a ton of access to data, and competition is stiff, with the total number of agents in the country rising back to pre-recession levels, if we are to judge by membership to the National Association of Realtors. “There’s so many agents out there and buyers are already on Zillow or Trulia, and they know everything, you need something to offer than what they already have access to,” Gold said. Steven Wynands, a Virginia-based Realtor, believes it’s mostly status quo in terms of the number of pocket listings, but it may seem like it’s more prevalent because more sites are popping up that list coming-soon listings or exist specifically to show listings that don’t make it to the MLS or haven’t yet been put on the market. Sites like thepls.com and The Zenlist in Chicago, offer these pre-market listings for homebuyers to scour. Zillow has a “coming soon” option for sellers to pre-gauge interest in their home. “With competition on so many fronts, agents need to find ways to increase their value,” Wynands said, echoing what Gold also pointed out. “Pocket listings — really “Coming Soon” listings — are one method of doing so.” James Bohan-Pitt, currently the managing director at DTP Ventures, founded a pocket listings app for agents back in 2015 called HipPocket, which is now closed. “Pocket listings are no more popular than they were when we launched in 2015,” he said. Bohan-Pitt explained that there are very few true pocket listings that never actually get listed on the market. There’s a difference between pocket listings and those “coming soon,” listings that will eventually make their way to the MLS. “Now almost every house in America starts its life as an off-market, ‘coming soon’ listing,” he said. “Sellers expect some pre-market activity. They will always get to market on the MLS.” One way that agents share listings before they hit the market, according to a thread on the Inman Coast-to-Coast group, is through private Facebook groups. Multiple commenters confirmed that brokerages and agencies like Douglas Elliman, Re/Max on the Charles and Realty One Group Mountain Desert all use private groups in one way or another to share listings that haven’t yet hit the market. ListFlash is a tool from zipLogix that aims to make it easier to circulate listings that haven’t hit the market yet to other agents within the office. For sellers, there are a number of potential reasons to go the route of keeping your house off the market, according to Gold. For many, it creates a sense of urgency for the buyer. “If new Nike Air Jordans come out, there’s a line around the block,” he said. “Then three weeks later, or month later, you can just go in and buy them.” In Los Angeles, Gold also deals with many high-profile clients who may not want their homes to hit the market for one reason or another. Ultimately, Gold believes sellers are best served with their listing hitting the MLS. He imparted some wisdom from his brother, who trained him in the real estate business. “It’s hard to promote something and keep it a secret at the same time,” he said.  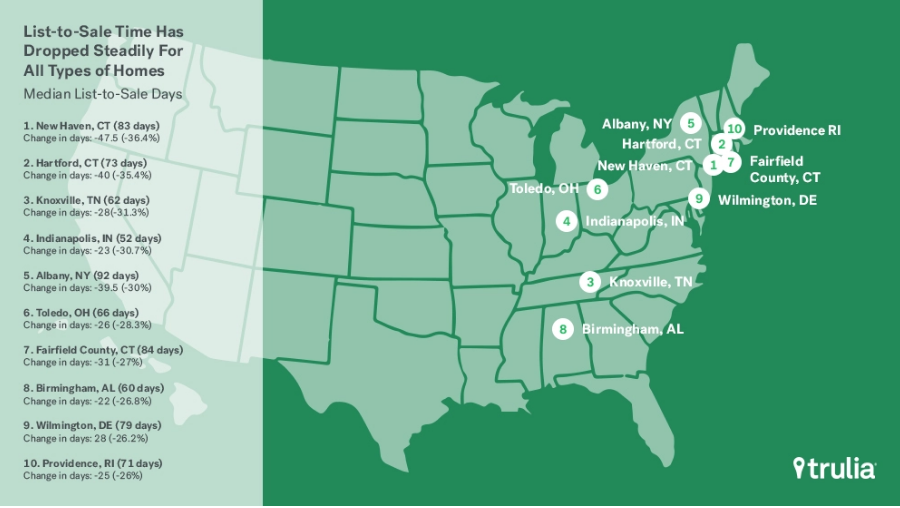 REPOSTED DIRECTLY FROM INMAN NEWS// WFG NATIONAL TITLE THIS CONTENT HAS NOT BEEN MODERATED BY HERITAGE HOME REALTY .Temperatures aren’t the only thing heating up this summer. List-to-sale times are blazing, much like they have been for the past few years — on average, homes are being sold within 64 days, down from 77 days in April 2017. April 2018’s list-to-sale time marks the eighth consecutive year of annual declines and is a new record low Seattle, San Francisco and San Jose are home to the quickest list-to-sale times, with listings being snapped up within 36 days. Buyers in New York, on the other hand, have more time to consider their options. In Syracuse, the list-to-sale time is 144 days; and trailing not too far behind is Long Island at 132 days, and New York City at 128 days. Syracuse, New Orleans and Honolulu are the only three markets out of the 100 largest metropolitan statistical areas (MSAs) to experience longer sales times compared to last year. Buyers bought starter and trade-up homes at breakneck speed, while premium homes lingered on the market. In April, premium homes stayed on the market 13 days longer than starter homes and 15 days longer than trade-up homes. The gap is expected to narrow as we move into peak summer home buying season, but it will widen again as fall and winter draw near. 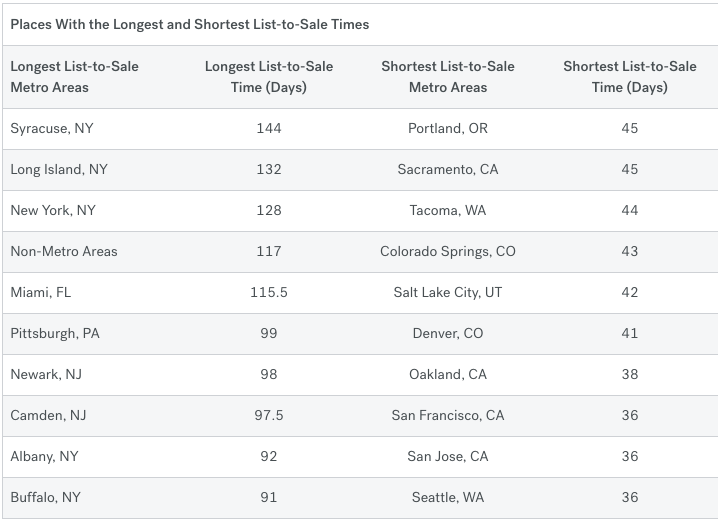 “During the 12 months ending April 2018, premium homes sat on the market a median of 19.5 and 23.2 days longer than starter and trade up homes, respectively,” noted the report.
“This gap has widened slightly over the past two years, up from 14.5 and 22.4 days during the same 12-month period a year ago and 13.8 and 19.1 days two years ago.” In April, the only two markets where premium homes sold faster than trade-up homes was Detroit and Toledo, Ohio. And over the past year, premium homes have sold quicker than starter homes in 24 percent of the nation’s 100 largest MSAs. About the analysisList-to-sale time on Trulia measures the median amount of time in which homes that were sold during a given period were on the market over a given geography while attempting to remove foreclosure and real estate owned (REO) sales. For this report, we looked at monthly intervals of home sales going back to January of 2010. Typical measures of days on market usually count the time between listing and when a home goes under contract. Our measure tracks the number of days between listing and when a home’s official transaction date occurred based on public records. This can make our measure of days on market look longer than the industry standard but, we feel, also better represents the actual time it is taking for transactions to go through the whole process. National and local Days on Trulia figures by price tier are calculated using starter, trade up, and premium price tiers for all metropolitan areas (or divisions where available) in the country. We define the price cutoffs of each tier based on home value estimates of the entire housing stock, not listing price. For example, we estimate the value of each single-family home and condo and divide these estimates into three groups: the lower third we classify as starter homes, the middle third as trade-up homes, and the upper third as premium homes. We classify a listing as a starter home on the market if its listing price falls below the price cutoff between starter and trade-up homes. Perris, CAWed Jun 06 2018
This week the median list price for Perris, CA is $359,900 with the market action index hovering around 54. This is less than last month's market action index of 55. Inventory has held steady at or around 183.Click here to stay informed with the Perris market! Market Action IndexThe Market Action Index answers the question "How's the Market?" by measuring the current rate of sale versus the amount of the inventory. Index above 30 implies Seller's Market conditions. Below 30, conditions favor the buyer. Strong Seller's Market The market has started cooling and prices have been flat for several weeks. Since we’re in the Seller’s zone, watch for changes in MAI. If the MAI resumes its climb, prices will likely follow suit. If the MAI drops consistently or falls into the Buyer’s zone, watch for downward pressure on prices. Real-Time Market ProfileNever miss important changes in the Perris market. Median List Price$359,900 Per Square Foot$182 Days on Market76 Price Decreased30% Price Increased9% Relisted9% Inventory183 Median House Rent$1,825 Most Expensive$1,250,000 Least Expensive$134,999 Market Action Index Strong Seller's Market54 Avg 7-DayAvg 90-DayJun 2015Aug 2015Nov 2015Jan 2016Apr 2016Jul 2016Sep 2016Dec 2016Feb 2017May 2017Jul 2017Oct 2017Dec 2017Mar 2018Jun2018$260K$280K$300K$320K$340K$360K$380KFriday, Sep 16, 2016● Avg 7-Day: $310,000The market appears to be hovering around this plateau. Look for a persistent change in the Market Action Index before we see prices deviate from these levels. Market SegmentsEach segment below represents approximately 25% of the market ordered by price. Median Price Sq. Ft Lot size Bedroom Bath $625,000 3,053 1 -2.5 acres 4 3 $388,000 2,600 8,000 -10,000 sqft 4 2 $340,000 1,920 6,500 -8,000 sqft 4 2 $275,000 1,440 6,500 -8,000 sqft 3 2 16662 Century St, Moreno Valley CA 92551 Our clients recently moved into their beautiful 5 bedroom 4 bath! Let us help you find your dream home. Come work with us today!
REPOSTED DIRECTLY FROM INMAN NEWS// WFG NATIONAL TITLE.THIS CONTENT HAS NOT BEEN MODERATED BY HERITAGE HOME REALTY  As anyone who regularly watches Flip or Flop already knows, house flipping is on the rise, and a new report from property data developer CoreLogic confirms this.
An analysis of public records found that the ratio of flipped properties to sales reached 6.2 percent in the first quarter of 2018, the highest it’s been since the first quarter of 2013 when home prices first started rebounding after the financial collapse. Directly after the crash in 2005, the ratio of flipped properties to sales climbed over 8 percent. Flipping — defined in the report as the act of acquiring a home then selling it within 12 months — is a different business now than it was right after the crash, CoreLogic found. “The first time it reached this level after the housing crash, home prices had just started to recover, and there were still a considerable number of distressed properties on the market,” the report states. “However, the flipping dynamics have changed over time. The share of distressed properties sold has declined significantly, from 30 percent in January 2013 to 4.4 percent at the end of 2017.” Home prices in some areas of the country have already passed the peak high values they reached before the crash, and valuations are showing no sign of slowing down. “High acquisition cost, tight inventory and rising flipping activities together point to possible speculation: investors are betting on continuous home price growth,” the report said. 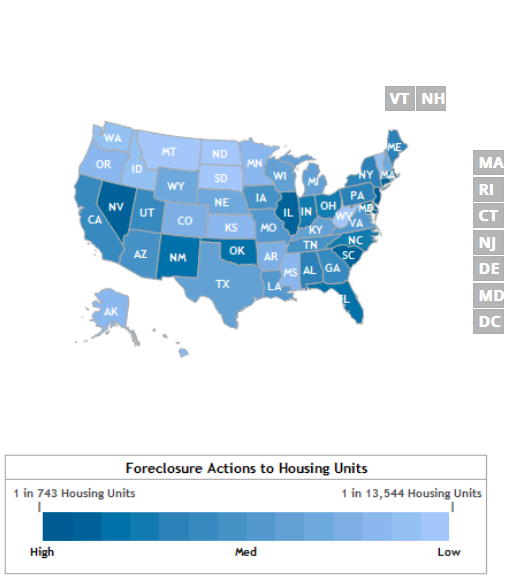 REPOSTED DIRECTLY FROM INMAN NEWS//.WFG NATIONAL TITLE. THIS CONTENT HAS NOT BEEN MODERATED BY HERITAGE HOME REALTY. Although issues with low inventory and fast-growing home prices still abound, the market has greatly improved since the housing bubble in 2006, and the latest foreclosure rates prove it. In 2017, residential home foreclosures fell 27 percent to 676,525 — the lowest level since 2005, according to a recent Experian report. “Thanks to a housing boom driven primarily by a scarcity of supply, which has helped to limit home purchases to the most highly qualified — and low-risk — borrowers, the U.S. housing market has the luxury of playing a version of foreclosure limbo in which it searches for how low foreclosures can go,” Attom Data Solutions SVP Daren Blomquist told Experian. “There are a few notable local market exceptions playing a different version of foreclosure limbo in which a backlog of legacy foreclosure activity left over from the last housing crisis is still winding its way through a labyrinthine foreclosure process,” Blomquist added, “resulting in incongruous jumps in various stages of foreclosure activity in markets such as New York, New Jersey, and D.C.” Western and Plains states have fared the best since 2005, thanks to affordable home prices, healthy jobs markets and relatively low costs of living. RealtyTracforeclosure data for April 2018. Click the graphic to see more. South Dakota
As of March 2018, only one in every 11,082 homes in South Dakota are in foreclosure, and only 0.01 percent of residential properties in the state are in foreclosure — 0.05 percent below the national average. According to Experian, an unemployment rate of 3.4 percent is key to South Dakota’s success. “A below-average jobless rate is key in reducing statewide foreclosure rates, as the more people who are gainfully employed are less likely to have their home fall into foreclosure,” the report notes. North Dakota Just like it’s neighbor to the south, North Dakota has an enviable foreclosure rate with only 1 in every 10,824 homes being taken back by the bank. The state has robust jobs growth, as energy companies flock to North Dakota and bring a wealth of job seekers and potential new homeowners. As a result, current homeowners who would’ve gone into foreclosure can quickly sell their home for a great price. Vermont is an outlier in the East Coast — according to RealtyTrac, New Jersey, Delaware and Maryland have some of the highest foreclosure rates in the country, with as much as 1 in every 605 homes being in some stage of the foreclosure process. Only 1 in every 7,176 homes are in foreclosure in the Evergreen state and its unemployment rate is at 2.8 percent, meaning that homeowners are more likely to keep up with their mortgages. West Virginia Thanks to strong buyer demand and home price appreciation values that are expected to grow by 3.6 percent by 2019, only 1 in every 6,384 homes are in foreclosure in West Virginia. But Experian warns that foreclosure rates may start to increase due to an unemployment rate (5.4 percent) that eclipses the national average (3.9 percent). Montana Only 1 in every 6,277 homes in Montana are in foreclosure, making the state’s foreclosure rate 0.02 percent below the national average (0.06 percent). Homeowners in the Treasure State are also benefitting from a 10.8 percent growth in home values since 2016, giving struggling homeowners the opportunity to sell their homes and avoid foreclosure. About foreclosure rates The ATTOM Data Solutions (RealtyTrac’s parent company) provides a count of the total number of properties with at least one foreclosure filing entered into the ATTOM Data Warehouse during the month and quarter. Some foreclosure filings entered into the database during the quarter may have been recorded in the previous quarter. Data is collected from more than 2,200 counties nationwide, and those counties account for more than 90 percent of the U.S. population. ATTOM’s report incorporates documents filed in all three phases of foreclosure: Default — Notice of Default (NOD) and Lis Pendens (LIS); Auction — Notice of Trustee Sale and Notice of Foreclosure Sale (NTS and NFS); and Real Estate Owned, or REO properties (that have been foreclosed on and repurchased by a bank). REPOSTED DIRECTLY FROM INMAN NEWS// WFG NATIONAL TITLE. THIS CONTENT HAS NOT BEEN MODERATED BY HERITAGE HOME REALTY. You may have hit the mouthwash this morning to avoid having bad breath, but are your clients still holding their noses because you suffer from commission breath? Real estate agents fall into two broad categories: those who are in it for the commissions and treat the clients as numbers, and those who put the client’s best interests first, even if it means not earning a commission. Commission breath can hit without warning. You need to start using “Commissterine if you are an agent who: 1. Delivers the ‘me-me-me, sign-here’ listing appointmentThese agents walk into a listing appointment and explain how great they are, how many houses they have sold and then say, “sign here.” Their only goal is to get the listing signed and then leave as quickly as possible without regard to questions or issues that the seller may have. 2. Focuses more on the money, than the clientThese agents look at the real estate sale as a piece of inventory that needs to be moved with little regard to the human side of the transaction. They ignore fears their clients may have about the transaction not closing, the difficulties associated with moving and how having a property on the market disrupts their clients’ lives and stresses them out. These agents track houses sold, not families served. 3. Over-promises and under-deliversThis type of commission breath often sneaks up on agents. The agent goes on a listing appointment and explains all the great marketing services and things he or she will do to get the seller’s property sold. These agents mean to do all of those things, but don’t ever get around to doing all that they promised. 4. Lies or does whatever it takes to get the dealUnlike the agents who at least intend to provide service, these agents have no compunction about telling lies or saying whatever it takes to get the listing signed or to close the deal. If someone else has an issue, who cares? 5. Takes the listing and disappears until it’s time to collect a checkThis is one of the most common types of commission breath. Sellers routinely complain that they haven’t seen their agent since they signed the listing. Other telltale symptoms include their listing agent isn’t notifying them about showings or providing them with reports about the market activity on their property. 6. Omits important factsAgents like this know there’s an issue with the property that needs to be disclosed, but because the sellers and buyers seem to be unaware of it, they keep their mouth closed. If the buyers can’t figure it out from their own inspections, that’s their problem. 7. Relies on the other agent to do all the workThese agents can be inexperienced, new or just plain lazy. Half the people who hold licenses didn’t close a deal last year. Most of these agents haven’t got a clue when it comes to solving transaction problems. In fact, the only way the deal will close will be if there’s a competent agent on the other side who steps in to do what it takes to close the transaction. 8. Never says ‘thank you’These agents never say “thank you” to their clients for their business, to the listing agent who changes his or her schedule to accommodate a showing or to any of the other people involved in the transaction. After all, these people are just doing their job — what’s the big deal about that? 9. Fails to stay in touch after closingThis type of commission breath hurts the agent the most. In my experience, agents who fail to stay in contact with past clients have an attrition rate of 20 percent a year. In other words, each year, 20 percent of these agents’ referral database will be contacting a different agent the next time they want to list or sell a property, simply because that first agent fell off the client’s radar. 10. They go to the highest bidderOne of the most surprising findings from the California Association of Realtors WomanUP! research is that the top women brokers who have been in business for 20 years or more generally will not hire someone with commission breath. They have no issue with a commission-breathed agent going to another company who is willing to pay them more. The way they spot this during an interview is that the agent’s first question is, “What’s your commission split?”  |
Heritage Home RealtyAny updates on properties will be on this page. Leave us feedback!
July 2018
|
 RSS Feed
